Real-Life Examples Across Industries
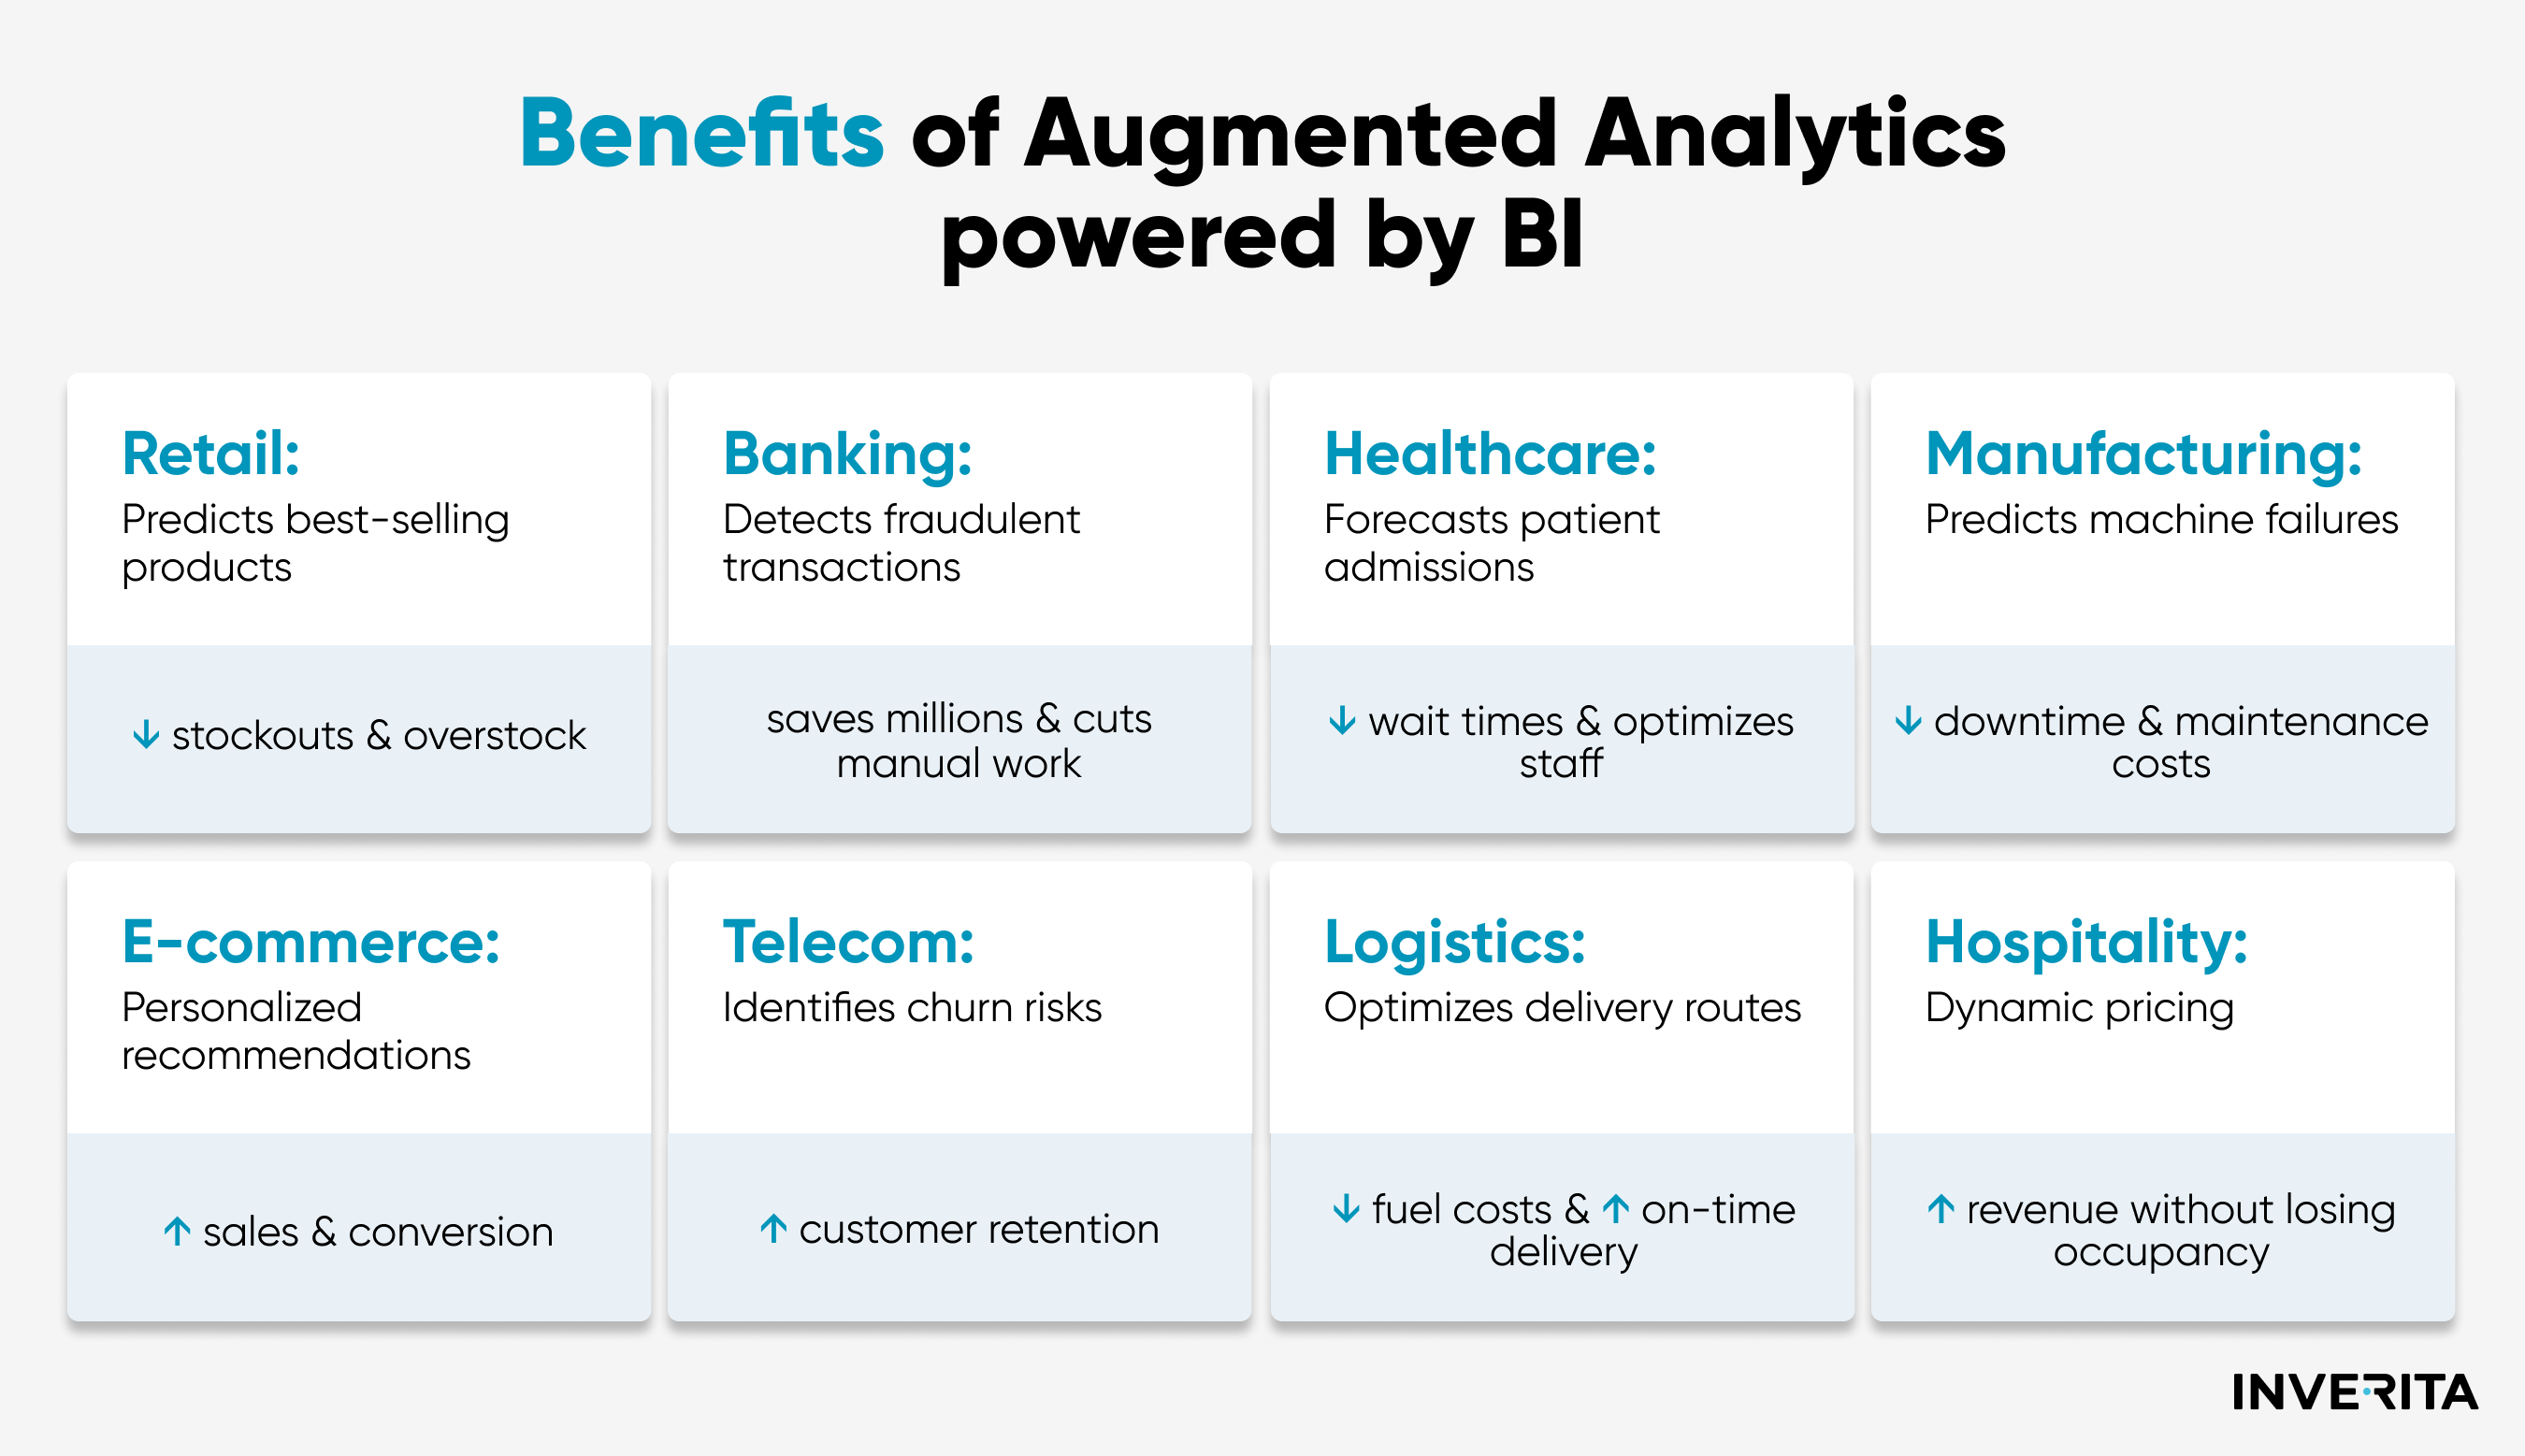
- Retail: Large retailers use AI-powered BI to analyze sales data, predicting which products will sell best in specific stores. This reduces overstock, prevents stockouts, and increases revenue.
- Banking: Banks leverage predictive analytics to detect unusual transaction patterns. Fraud is flagged instantly, saving money and protecting customer trust.
- Healthcare: Hospitals monitor patient admissions, treatment outcomes, and resource utilization using BI dashboards. This helps optimize staffing schedules and improve patient care.
- Manufacturing: BI tools track machinery performance and maintenance schedules. Predictive maintenance prevents costly breakdowns and reduces downtime.
- E-commerce: Online retailers analyze customer browsing and purchasing behavior to offer personalized recommendations, boosting conversion rates and average order value.
- Logistics: Delivery companies use BI to optimize routes and monitor fleet performance, cutting fuel costs and improving on-time delivery.
Top 6 Business Intelligence Trends in 2026
Now, let’s have a look at current trends in business intelligence.
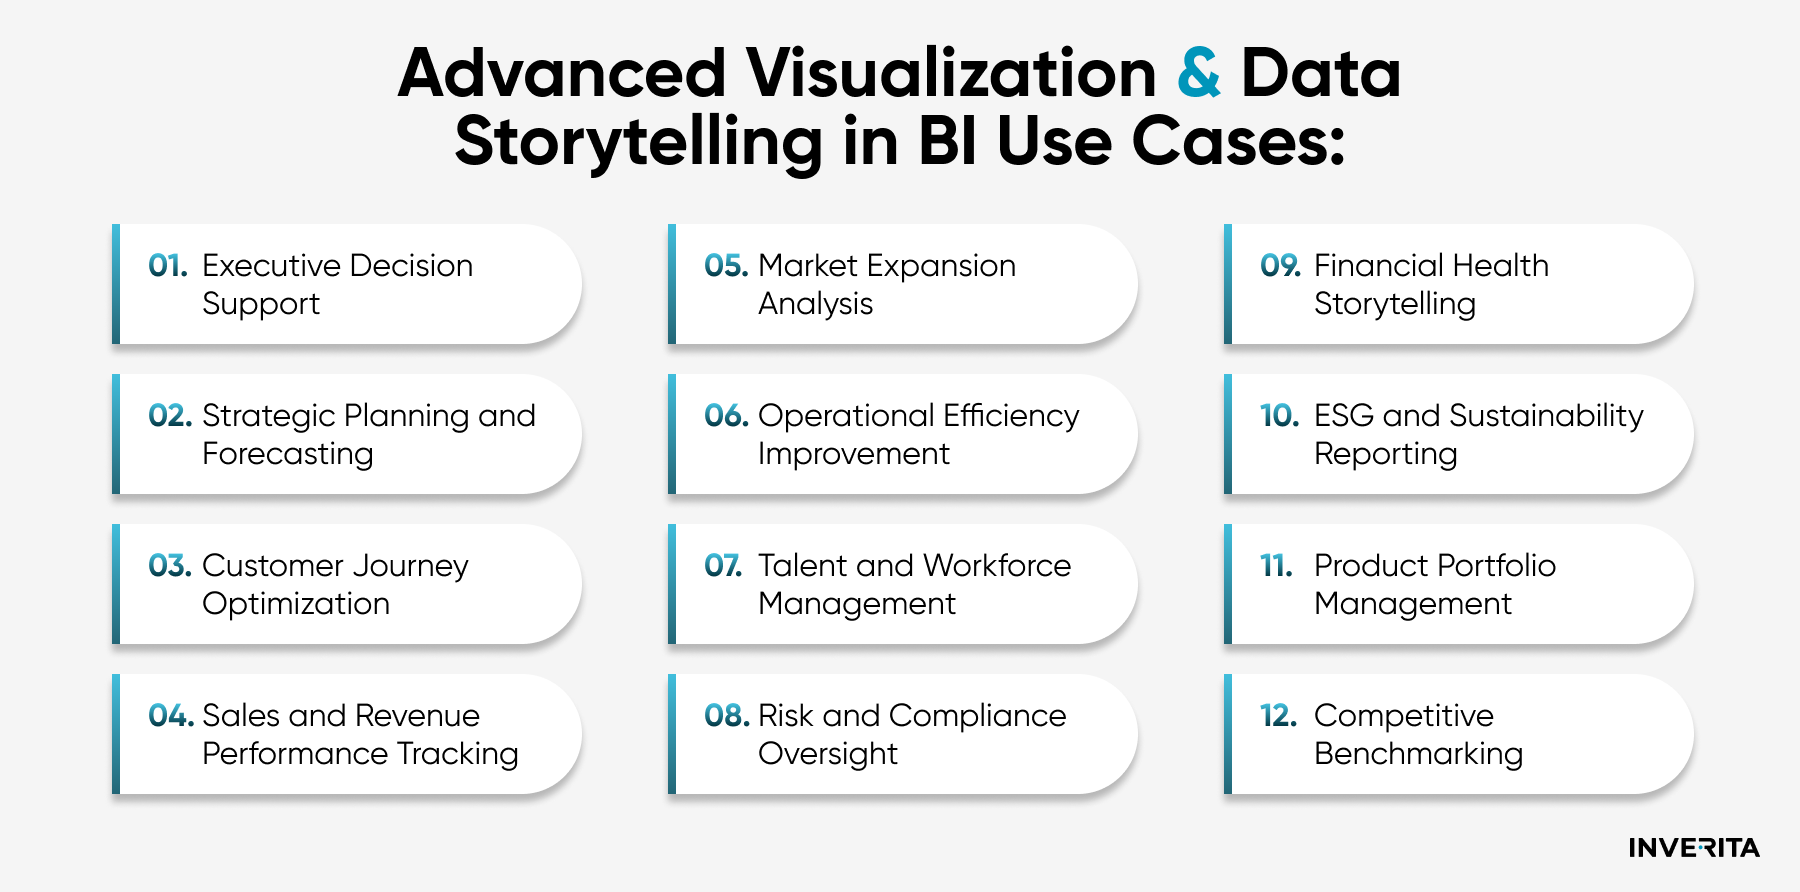
# Advanced Visualization & Data Storytelling
Despite the heavy investments in BI, unfortunately, most projects still don’t succeed, and the lack of advanced data visualization is one of the main reasons for it.
Data visualization is the graphical representation of data using charts, graphs, and maps, often displayed in a dedicated dashboard. Its goal is simple: make complex data clear and easy to understand.
But in 2026, data visualization is evolving far beyond static charts, integrating business intelligence industry trends:
Smarter and More Interactive Dashboards
Dashboards are transforming into intelligent, interactive environments. Instead of passively displaying numbers, they now react to user behavior and market changes in real time.
With generative AI integration, users can type or even speak a question and receive a clear, narrative-style answer. These dashboards also learn from user preferences, automatically surfacing the most relevant insights and reducing time spent searching for data.
Immersive Data Exploration with AR/VR
As AR/VR adoption grows, businesses are beginning to use 3D environments to work with complex, multidimensional data. This is especially valuable for sectors like healthcare, manufacturing, and logistics, where visualizing processes or performance data spatially makes patterns easier to identify and decisions faster to make.
From Data to Stories
Modern BI is shifting from “just visualization” to data storytelling. Instead of leaving executives to interpret charts themselves, dashboards now provide context explaining why the business metrics changed, what influenced a trend, and what action might come next. This combination of visuals, annotations, and narrative helps decision-makers move from data to action with confidence.
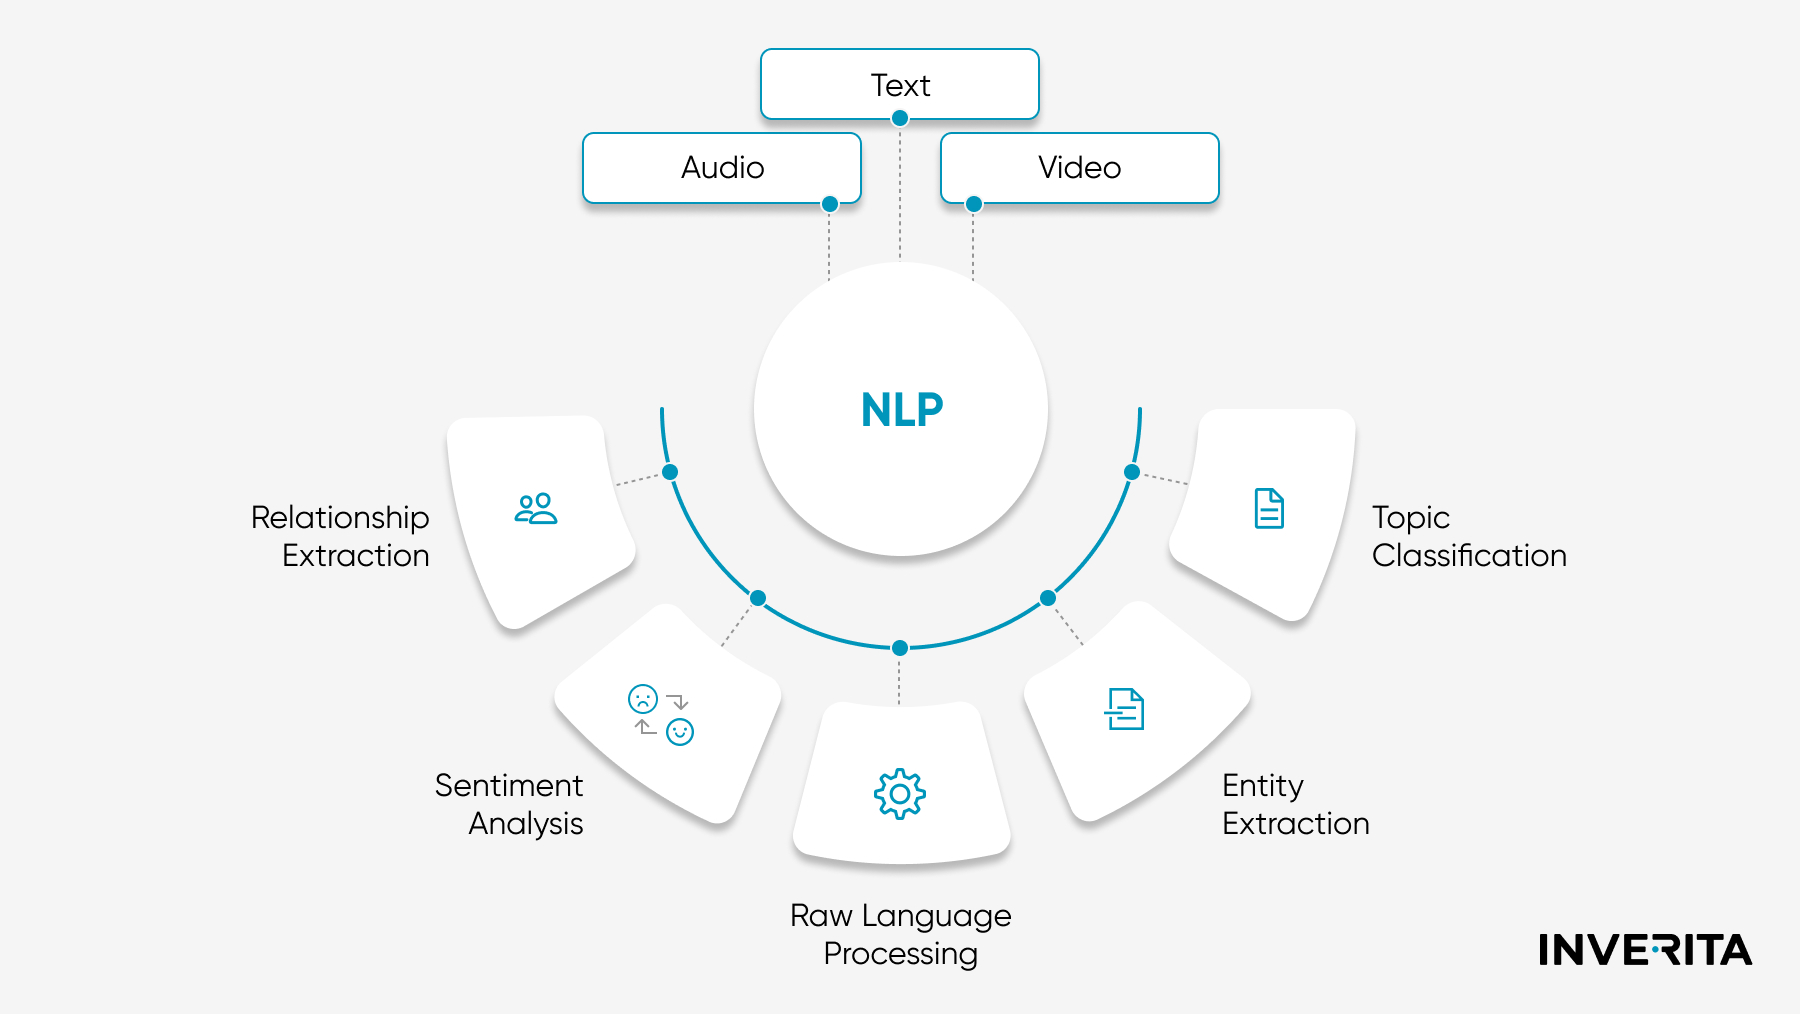
# NLP Processing in BI Tools
Natural Language Processing is becoming a game-changer for business intelligence. According to Statista, the global NLP market reached USD 53.42 billion in 2025, underlining its growing importance.
The appeal is clear: NLP allows users to interact with data using simple, conversational language. Instead of writing complex SQL queries or relying on technical teams, business users can simply type or speak a question like “What were our top five products last quarter?” and receive an instant, visualized answer.
This makes data access faster and more inclusive, empowering decision-makers across all departments. For organizations dealing with massive datasets, this is a crucial step toward true data democratization.

_1758805031.jpg)



_1764586939-small.webp)